ES
ES  IT
IT ScoreTrend's Dynamic Line Stats is a great tool for analysing a football match both pre-match and live. This tool is placed within ScoreTrend and specifically below the bar graph of the selected match. Clicking on the Dynamic Line Stats tag opens the tool you are analysing in detail in a new window. There is a more complete and high-performance desktop version and a smartphone version with less functionality but with everything you need for mobile analysis.
It is called dynamic line stats because the dynamic line that appears above the graph of the game being played can be moved to a specific minute chosen by the user. Selecting the minute with the cursor provides statistics before and after that minute or for a range of values. As the game progresses, the desired statistics are obtained above the graph being formed. No more going to other sites or wasting time unnecessarily losing concentration and market opportunities. On Score Trend you have everything with one click.
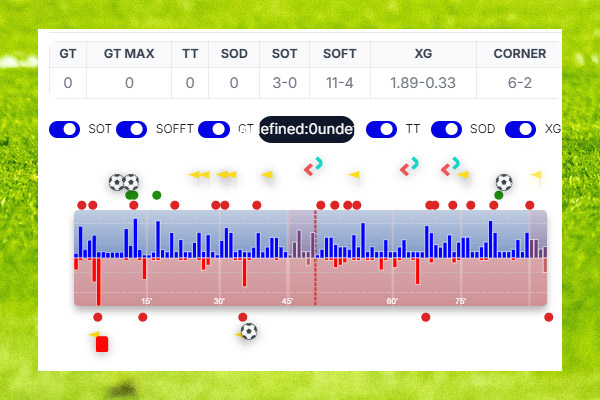
On a dark grey line representing the complete duration of the match (from the first minute to the end, including stoppage time) the statistics selected by the user are inserted at the exact minute. The numbers are important, but the visual impact is something else, more powerful and immediate.
Go to the website of ScoreTrend
What the dynamic line stats are for
Dynamic Line Stats is used to study a pre-match and live match as there are results from the current season that can be filtered according to the chosen competition such as:
- national championship
- national cup
- European cups (UEFA Champions League, Europa League, etc), South American or Asian cups
- Friendly matches
- Nations competitions (World Cup, European Championship, etc)
The matches of the current season have the date on which they were played and are coloured according to the result achieved, i.e. green for a win, yellow for a draw and red for a loss. With the filter at the side for the desktop version and at the top for the mobile version you can choose for both teams:
- All > all matches played home and away
- Home > home matches
- Away > away matches
By default, as this is the correct situation, home matches are selected for the team playing at home and away matches for the team playing away.
We have included for a qualitative study the position in the standings in all matches of both teams: in this way you can check with whom those results were made. A match between two teams of the same value (standings position) has a different performance between two teams in extreme standings positions. Two teams playing for the title with strong attacks and defences will have a different trend in terms of goals, corners etc than a strong team and one of the last positions. The number in brackets indicates the ranking position of the team.
Live and pre-match statistics
In the dynamic line stats you will find all the most frequently used live and pre-match statistics that you need to understand the course of a match or make bets in the most popular markets.

As soon as you enter the Dynamic Line stats window, you must select the chosen competition from those available otherwise the system will not give any results or statistics. The last five matches of the season are loaded by default. If you want all matches you have to select the LOAD MORE button several times and the last 5 matches will be inserted in blocks. The total statistics are made up of all matches of the current season.
You can choose which statistics to display with the selector at the top and can be changed by left-clicking.
The statistics present are as follows in order of appearance:
- Goals (total, scored and conceded)
- Yellow cards (for both teams)
- Red cards
- Goal kicks (blue home team, red away team)
- Shots on goal
- Shots on goal
Once the selection has been made with the corresponding icon, the events (goals, corners, shots on goal, etc.) will be placed in the match played in the previous match in the exact minute they occurred. For example, if you select the goal made with the black and white dot, the goal made by the team in that exact minute will be placed. The same applies to all other statistics that are selected.
You can make a very in-depth study of the match by looking at what has happened in recent matches and consequently the team's state of form.
Goal Line and Range
There are two display modes for the statistics of the current season's matches between the two teams, which are crucial for match analysis.
The two modes are:
- single > goal line moving with the mouse over the graph in the selected minute (desktop version only)
- range > you can select a range of minutes with the cursor

In this way, statistics are entered into the panel according to the selected mode. For example, goal statistics are taken into account, but the same applies to yellow cards, red cards, corner kicks, shots on goal and shots away from goal.
If you select single mode the statistics are as follows (depending on whether you select all, home or away):
- Scored > total goals scored in previous games of the season
- conceded > total goals conceded
- Goals BM > goals before the selected minute with the line in percentage and number terms next to the BM
- Goals AM > goal after of the selected minute
- AVG TOTAL > team's total goal average (always total, home and away respectively)
- AVG BM > goal average before the selected minute
- AVG AM > goal average after the selected minute
You can study in numerical and percentage terms the goals before and after a certain minute, yellow cards etc.
How to study the match with Dynamic Line Stats
ScoreTrend's Dynamic Line Stats is the ultimate tool for studying a football match in numerical and especially visual terms. While you are trading in real time on a match and for example an alert has arrived via telegram you go to the match and select the tool.
Based on the minute and the value of the Goal Trend index, a fundamental tool to understand if a goal is on the way, you go and see at that particular minute what has happened in past matches of the current season. It should be pointed out that a team has a certain mode of play and tactics throughout the match: consequently it tends to score or concede goals in a specific time frame that is generally repeated over time. Obviously a goal can come in any minute but it tends to be that for a team goals come in well-defined bands that can be identified on our goal bar.
In a given market, whether it is over or under, you must always enter in the minute that is statistically most favourable, i.e. where the most goals are concentrated (if you do over). In this way you are working with higher odds and consequently by respecting money management you will be in profit in the long run.
There are teams that enter the field looking for a goal straight away, or teams with fast players, skilled in counter-attacks, that score more goals in the final minutes when they spread out due to player fatigue. One must identify these minutes, which must be in correspondence with a high intensity of play given of course by our jewel the Goal Trend.
One must only enter the market when the conditions are right and not without a reason.

Gianluca Landi
Professional Sports Trader | Founder of ScoreTrend
Sports trader since 2007 and online with the first sports trading site and courses since 2011. Engineer specialized in data analysis and betting exchange strategies. Amazon bestselling author and founder of ScoreTrend, the leading platform for match trading and betting with proprietary indicators such as xTrend, Goal Trend, SOD, and Draw Balance.