ES
ES  IT
IT
xGoal, short for Expected Goals, is an advanced statistical metric "connected" to the player. This metric quantifies the probability that a shot will result in a goal, providing an assessment of the offensive threat posed by teams and players.
For live betting, xG is an additional indicator for understanding the threat posed by an attacking move.
Definition and Meaning of Expected Goalss
Expected Goals measure the quality of scoring opportunities using a mathematical model. Each shot is assigned a value between 0 and 1, where 0 indicates an absolute impossibility of scoring and 1 represents a virtually certain goal.
Expected goals arose from the need to understand how many goals a team should have scored, regardless of the final result. The value obtained is based on the analysis of hundreds of thousands of shots in past matches.
How the Measurement Scale Works
The numerical value of xG expresses a direct percentage of achievement. A shot with an xG of 0.1 has a 10% chance of becoming a goal. Conversely, an opportunity with an xG of 0.9 represents a 90% chance of success.
Penalties have a fixed xG that varies between 0.76 and 0.79. This means that historically, out of 100 penalties taken, approximately 77 result in a goal. A shot taken one metre from the goal can reach a value of 0.99. It does not reach a value of 1 because players sometimes miss even when facing an empty goal.
Origins and Development of the Metric
The Expected Goals methodology was initially introduced by Alan Ryder to measure the quality of shots in ice hockey. Football subsequently refined this metric, making it one of the most widely used tools in football analysis.
In recent years, xG has become a standard in the football industry. Coaches, match analysts, bookmakers and bettors use this statistic to evaluate player performance or place bets.
xGoal Calculation Methodology
The calculation of Expected Goals is based on statistical models that process enormous amounts of historical data. There is no single universal xG model. Different providers use proprietary algorithms with variations in the parameters considered. It should be noted that shots are not the same for all providers. A shot on goal, off target or cross is catalogued differently by those who collect the statistics. As a result, each provider has its own metrics and different ways of determining the number of shots. xGoal is not a constant and certain value for all sites.
The process begins with the collection and analysis of hundreds of thousands of shots. Each conclusion is catalogued according to multiple variables, creating a comprehensive database used for calculation.
Main Variables of the Model
Distance from the goal is the most relevant factor in calculating xG. A shot taken from inside the penalty area always has a higher value than a shot from 25 metres. The model analyses thousands of similar shots to determine the success rate from each specific distance.
The angle of the shot is another key parameter. A shot taken directly in front of the goal offers a better chance of success than a shot taken from the side at a tight angle. The algorithms geometrically calculate the width of the portion of the goal visible from the point of the shot.
Advanced Calculation Parameters
The most advanced calculation parameters for expected goals are:
- Position of defenders and their distance from the shooter
- Position of the goalkeeper in relation to the goalposts
- Part of the body used for the shot (right foot, left foot, head, other parts)
- Type of assist received (through ball, cross, set piece)
- Type of attacking action (manoeuvre, counterattack, free kick)
- Speed of play and defensive pressure
Mathematical models and machine learning
The most sophisticated models use machine learning algorithms to continuously refine the calculation method. Through these machine learning algorithms, the systems improve their accuracy based on new variables.
Artificial intelligence (AI) allows interactions between multiple variables to be considered. A predictive model can understand different situations: a left-footed shot from 18 metres with a defender 2 metres away has a different probability than a right-footed shot.
Differences between Providers
Opta, StatsBomb, Wyscout and other platforms offer xGoal models with significant differences. Some consider only basic variables such as distance and angle, while others integrate over 20 different parameters. This variety explains why the same match can show different values.
The most advanced models even consider the speed of the ball, the height of the shot above the ground and even the behavioural patterns of the opposing goalkeeper. The choice of model significantly influences the values obtained.
Applications of xG in Football
Expected Goals can be applied in numerous contexts. This metric can help to discover talent in an 'automatic' way.
Professional teams invest significant resources in data analysis that uses xG as a metric for evaluation.
Adding up the xG of all a team's shots in a match gives an indicator of offensive threat. A team with an xG of 2.5 that scores only one goal highlights a finishing problem: it is underperforming.
Conversely, scoring 3 goals with only 1.0 xG indicates overperformance. In the long run, teams tend to converge towards their xG values.
Team analysis using xG allows tactical trends and areas for improvement to be identified. Coaches and technical staff use this data to optimise offensive and defensive strategies.
Individual xG values allow us to assess a striker's ability to find themselves in the right positions on the pitch. A player who accumulates high xG values demonstrates excellent positional sense, regardless of the goals scored.
Comparing xG and actual goals reveals a player's clinical finishing ability. Players such as Erling Haaland and Kylian Mbappé consistently exceed their xG, a sign of above-average ability in finishing chances.
Expected Assists (xA) complete the assessment picture by measuring the quality of passes that lead to shots. Creative players with high xA values demonstrate an ability to set up teammates in favourable positions.
The difference between goals scored and xG accumulated over the course of a season highlights periods of positive or negative form, helping to predict regressions to the mean.
Clubs use xG to identify undervalued talent. This analysis reduces the risk in transfer market investments.
A defender who concedes few xG to opponents demonstrates excellent positioning and interception skills.
Team analysis using xG allows tactical trends and areas for improvement to be identified. Coaches and technical staff use this data to optimise offensive and defensive strategies.
Derived Metrics and Advanced Statistics
The Expected Goals ecosystem has expanded with numerous derived metrics that offer increasingly sophisticated levels of analysis. These complementary statistics provide a comprehensive view of performance.
Each derived metric adds specific information that standard xG does not provide.
PSxG considers where the ball actually ends up after the shot. While traditional xG is a pre-shot probability, PSxG evaluates the quality of the shot by including its trajectory and position in the goal.
This metric uses the coordinates of the shot on target to calculate the probability of a goal. A central shot into the goalkeeper's hands will have a lower PSxG than the same shot placed under the crossbar, even if the pre-shot xG was identical.
xGOT only considers shots directed at the goal, excluding shots that are off target or blocked. This metric evaluates the shooter's ability to shoot the ball accurately towards the goal.
The difference between xGOT and xG measures Shooting Goals Added (SGA), which quantifies the contribution of a player's shooting ability relative to the average. Players such as Lionel Messi consistently show high positive SGA values.
xA measures the quality of passes that generate shots. An assist that leads to a 0.8 xG chance is more valuable than one that generates a 0.1 xG shot.
This metric identifies players with high assist skills and the ability to put a player in a position to score. Attacking midfielders and attacking midfielders are evaluated using xA.
xPTS uses the xG of both teams to calculate the statistically expected result of each match. Adding these values over an entire season gives the ranking according to chances created and conceded.
Teams with xPTS significantly higher than their actual points have suffered from bad luck or poor finishing. Conversely, lower xPTS suggest overperformance that is likely to even out over time.
Operational limitations of Expected Goals
Despite the analytical power of xG, this metric has limitations and requires careful interpretation. Understanding what xG can and cannot do is essential to using it correctly.
Expected Goals do not replace qualitative analysis but complement it. The combination of quantitative data and experience produces the most accurate assessments.
What xG Cannot Measure
xG does not capture the individual skill of the shooter in standard models. A shot with 0.2 xG has the same theoretical probability with any player, even though in reality the probabilities differ.
The quality of the opposing goalkeeper is not considered in the basic models. A chance against Thibaut Courtois theoretically has the same xG as one against a lower-level goalkeeper.
Variability in Small Samples
In individual matches, xG can show strong variability in results. A team can dominate xG but lose due to statistical variance. Only over large samples (at least 10-15 matches) does xG become more reliable.
Random events such as lucky deflections, individual errors or refereeing decisions influence short-term results. xG indicates long-term trends, not immediate certainties.
Tactical and Situational Context
xG does not take into account the context of the match. A shot in the 90th minute with the score at 1-0 has different implications than the same shot in the first half of a 3-0 match. The psychological pressure and importance of the moment are not captured by statistical models.
Particular tactical situations can distort xG. A team managing a lead may concede low-quality shots to their opponents while controlling the game, showing similar xG but actually dominating. That is why we have refined this metric in XTrend for use with Goal Trend and Sod in ScoreTrend.
Best Practices in Using xG
- Use samples of at least 10-15 matches for reliable assessments.
- Combine xG with direct observation of matches.
- Use Xtrend with Goal Trend and Sod (ScoreTrend indicators).
- Consider the tactical context and specific circumstances.
- Always compare xG scored and conceded, not just absolute values.
- Check which xG model is used by the source.
- Integrate with other advanced metrics for a complete picture.
Case Studies: Match and Season Analysis
The practical application of Expected Goals is clearly demonstrated through concrete examples. Analysing specific matches and seasons reveals how xG provides insights that simple results hide.
Case studies demonstrate recurring patterns: teams that overperform or underperform their xG rarely maintain these deviations in the long term. Regression to the mean is a fundamental principle of statistical analysis.
Napoli finished the season with 82 actual points against 71 calculated xPTS. This 11-point difference indicates significant overperformance. The additional points are due to a combination of individual skill and favourable conditions such as absence from European competitions.
Inter showed 81 actual points against 75 xPTS, a more modest overperformance. Monza showed the opposite case: 18 actual points against 31 xPTS, signalling a drastic underperformance. With 28 goals scored against 32 xG, the Brianza team also underperformed offensively.
In the match that ended 3-0 for Verona on 18 August 2024, the xG told a different story. Verona totalled 1.81 xG while Napoli only 0.81. This means that Verona significantly outperformed, scoring almost twice as many goals as expected.
Similar cases highlight how individual matches can deviate significantly from statistical expectations. On a seasonal basis, these anomalies tend to offset each other.
xG in Sports Betting and Trading
Expected Goals have revolutionised the approach to sports betting. Bettors use xG as the basis for their strategies.
The integration of xG into pre-match and live analysis has created new opportunities.
A value bet occurs when the probability implied by the bookmaker's odds is lower than the actual probability calculated using certain predictive models. Teams' historical xG allows these actual probabilities to be estimated.
A team that consistently accumulates higher xG than its opponents but has high odds represents potential value. The market may not yet have recognised the team's actual quality, creating opportunities.
The sum of the average xG of two teams provides an estimate of the total expected goals. Home and away xG trends further refine these predictions. Teams that maintain high xG regardless of the venue show consistency, making bets more reliable.
During live matches, comparing accumulated xG with the current score creates trading opportunities. A team with 2.0 xG against their opponent's 0.5 but trailing 0-1 could offer value for a comeback.
Professional traders monitor xG minute by minute, identifying moments when the odds do not yet reflect a team's statistical dominance. ScoreTrend offers live charts for xGoal.
ScoreTrend: Live xGoal Monitoring
ScoreTrend represents a breakthrough in live match analysis thanks to the integration of advanced Expected Goals monitoring tools. The platform offers unique features that transform the use of xG in betting and sports analysis.
The system developed by ScoreTrend allows you to view the evolution of xGoal minute by minute.

Live Minute-by-Minute xGoal Chart
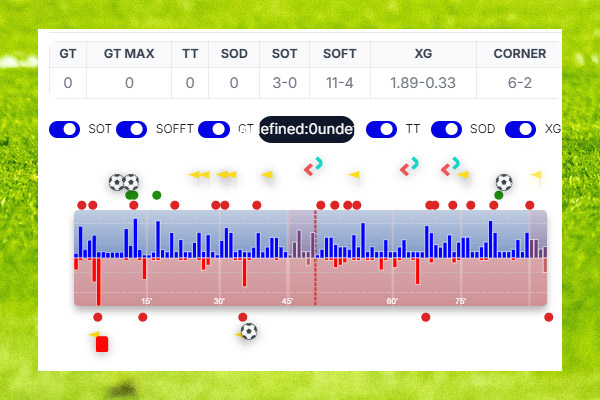
ScoreTrend is one of the few platforms that offers real-time graphical display of xG with continuous updates. For major matches where Expected Goal is calculated, an interactive graph is available showing the progressive trend of xG for both teams. Blue represents the home team, red the away team.
This tool allows you to immediately identify moments of increased offensive pressure. A rapid increase in the xG curve indicates a dominant phase of play with potential goal opportunities.
Live alerts on xGoal and Advanced Statistics
A distinctive feature of ScoreTrend is its customisable alerts on the xGoal metric. Users can set notifications that are triggered when a team's xG exceeds certain values during the match.
These alerts allow you to monitor dozens of matches simultaneously without having to manually follow each graph. When a match reaches predefined xG conditions, the system sends an immediate notification via Telegram bot.
Integration with Live Scanner and Filters
ScoreTrend's Live Scanner integrates xGoal with other proprietary indicators such as Goal Trend and Team Trend. Advanced filters allow you to search for matches that meet multiple criteria simultaneously: current score, minute of play, accumulated xG and other statistical parameters.
For example, a trader can filter matches in the 70th minute with a score of 0-0 but an xG greater than 2.0 for one of the teams. This identifies situations with high potential for an imminent goal. This combination of data creates highly sophisticated betting strategies.
Bi-directional bar charts with live statistics
ScoreTrend uses bi-directional bar charts updated every 30 seconds that display not only xG but also shots on target, shots off target, corners and dangerous attacks. This immediate visual representation makes it easy to understand the progress of the match.
The charts include injury time and substitutions, providing the complete context needed to correctly interpret xG evolution. Perfect synchronisation between different data streams creates an unprecedented analysis experience.
Xtrend exceeding xGoal
xTrend is a proprietary indicator from ScoreTrend that goes beyond the meaning of xGoal. Xtrend indicates the total number of goals expected during the match. xTrend should be used in conjunction with GT and SOD. When the three graphs spike upwards or 'cross', a goal is usually scored.
xTrend, GT and Sod provide three different snapshots of the match. These three indicators represent different but complementary conditions. When the graphs converge, you have accurate information about what will happen. The xTrend, GT and Sod graphs are visible in Multichart, an essential tool for live betting.
As with xGoal, we have xTrend alerts.
Competitive Advantages of ScoreTrend
ScoreTrend offers a complete ecosystem for analysis based on xGoal, Xtrend, GT, TT and Sod:
- Live minute-by-minute xG charts with real-time updates.
- Customisable alert system based on xGoal, GT, TT, xTrend and Sod thresholds.
- Advanced filters that combine xG with results, minutes and other indicators.
- Integration with Asian odds.
- Prematch Scanner and Live Scanner with historical xG analysis of teams.
- Dedicated community and tutorials to maximise use of the platform.
xG statistics for leagues and competitions
Each league has distinctive characteristics in terms of xG. Different competitions show specific statistical patterns.
Comparative analysis of xG between leagues reveals insights into qualitative differences and playing styles in different countries.
Serie A traditionally has lower average xG per game than other top European leagues. Italian tactical culture favours defensive organisation and space management, limiting the creation of high-quality chances.
Teams such as Juventus and Inter excel at limiting their opponents' xG. This philosophy is reflected in the seasonal data, with particularly low xGA (xG Against) figures.
The English league generates the highest xG volumes among the major European leagues. The intense pace and attacking approach of most teams frequently produce matches with 3-4 total xG.
Manchester City and Liverpool regularly show xG values above 2.0 per match, highlighting their consistent offensive dominance. The Premier League also has greater variance in xG, with statistically very unbalanced matches.
The German league is characterised by high xG resulting from rapid transitions and counterattacks. The philosophy of high pressing and open spaces generates high-quality chances from one-on-one situations.
Bayern Munich dominates xG with some of the highest values in Europe, often exceeding 2.5 per game. However, mid-table teams show more balanced xG values than other leagues, a sign of competitiveness.
The Spanish league features xG values resulting from prolonged ball possession. Teams such as Barcelona generate chances through elaborate combinations rather than vertical actions.
The difference between the xG of big and small teams is marked in La Liga, reflecting technical and tactical disparities.
The Future of Expected Goals
The evolution of Expected Goals is moving towards increasingly sophisticated models that integrate artificial intelligence, position tracking and automated video analysis. The future promises unprecedented precision metrics.
Technological innovations in data collection and computational analysis will open up new frontiers in football tactics through advanced predictive metrics.
The next generation of xG will incorporate the specific ability of the shooter. With machine learning, a standard 0.2 xG shot becomes 0.35 when kicked by a strong striker and 0.12 when executed by a defender. These customised xG values will provide more accurate predictions, recognising the qualitative differences between players that current xG values ignore. The impact on betting and market valuation will be optimised.
Optical tracking technologies will allow the exact position of all players on the pitch at the moment of the shot to be taken into account. xG will incorporate not only the presence of defenders but also their specific postures, orientations and distances.
Computer vision and automated video analysis will extract additional features: ball curvature, height above the ground, rotation speed. Every physical aspect of the shot will contribute to the calculation of the probability of a goal.
Emerging research is exploring the integration of psychological factors into xG. The pressure of the moment, the importance of the match and the mental state of the shooter all influence the values.
Metrics combining biometric data, game situations and psychological history could produce contextualised xG.
Predictive algorithms will analyse the flow of the game in real time to predict the expected xG in the coming minutes. Instead of having xG already generated, the systems will anticipate phases of imminent pressure.
This predictive capability will transform live trading, allowing odds movements to be anticipated before events occur. The competitive advantage for those using these tools will be significant.
Tools and providers for xG analysis
Numerous providers offer access to Expected Goals data and visualisations. The choice of the appropriate resource depends on specific needs: professional analysis, betting, scouting or simple statistical insight.
xG ranges are available on free sites with basic functionality or professional platforms with advanced graphics, alerts and APIs for custom integration.
Professional Platforms
Opta and StatsBomb represent the gold standard for professional xG data. Used by clubs, federations and broadcasters, they offer the most sophisticated models and comprehensive historical databases. Their high costs make them accessible mainly to bookmakers or football clubs.
Wyscout and InStat provide not only xG but also comprehensive integrated video analysis platforms. Scouts and analysts can view every shot with its xG within the video context of the match.
Solutions for Betting and Trading
ScoreTrend stands out for its specialisation in live tools for betting and trading. Real-time xG charts, customisable alerts and integration with Asian odds create an optimised ecosystem for sports traders.
Footystats and SofaScore offer free xG statistics for most leagues. The quality of the models is lower than professional solutions but sufficient for amateur analysis and performance contextualisation.
Analysis and Visualisation Tools
FBref provides comprehensive xG databases for players and teams with comparison and ranking features. The platform integrates xG with other advanced stats to create comprehensive analytical profiles.
Understat specialises in interactive xG visualisations with shot maps and timelines. The user-friendly interface makes sophisticated match and season analysis accessible even to non-experts.

Gianluca Landi
Professional Sports Trader | Founder of ScoreTrend
Sports trader since 2007 and online with the first sports trading site and courses since 2011. Engineer specialized in data analysis and betting exchange strategies. Amazon bestselling author and founder of ScoreTrend, the leading platform for match trading and betting with proprietary indicators such as xTrend, Goal Trend, SOD, and Draw Balance.