ScoreTrend | Charts, statistics, livescores of all matches
ScoreTrend is a revolutionary website with bar charts of all world football matches, livescores, odds and all the information and statistics needed to follow and analyse a match in detail. This application was born from the idea of Gianluca Landi to fill the gap of advanced tools that could facilitate the work of the sport trader and bettor. In a single tool there is everything you need to analyse a game in depth. Here nothing is left to fate: everything is taken care of in the smallest details as it is the tool made by those who operate every day on the market and it has been designed and conceived to have everything under control in a single screen.
Go to ScoreTrend website
How Scoretrend works
The main core of score trend is characterised by the coloured chart that describes precisely how the two teams are playing. Within the website and future android and ios application we find many advanced tools and instruments that we list below:
- bar graphs
- goal trend graph (GT)
- Team Trend graph (TT)
- complete live statistics
- live results
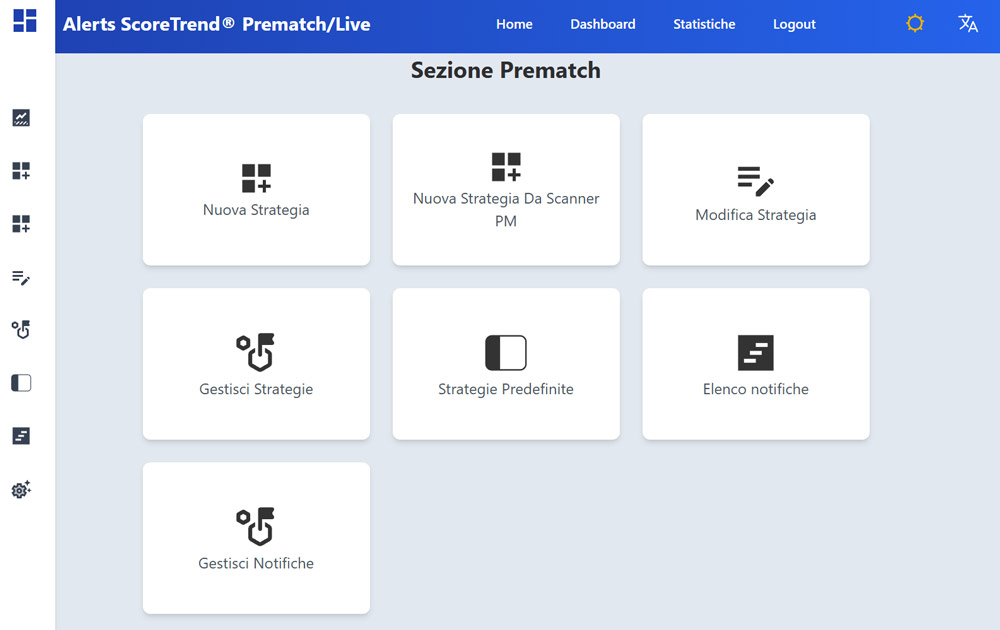
- notifications and favourites
- ranking
- training
- events
- pre-match statistics (next month)
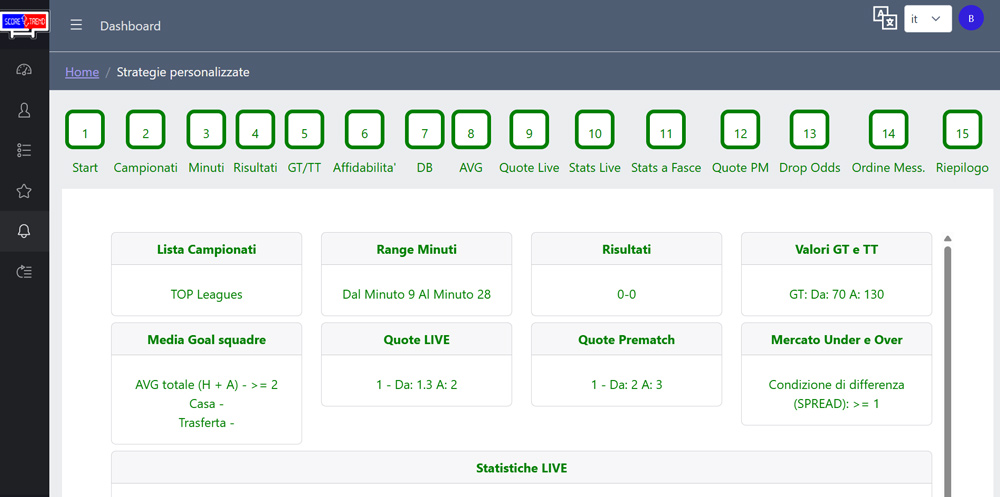
- beta testing of strategies with statistics and odds for every minute of play
- asianodds (next)
- full telegram alerts (next two months)
This project is open and constantly evolving with the periodic introduction of new tools and markets that will be implemented over the next few months. The goal is to create a professional, advanced tool that allows you to trade automatically by being able to enter and satisfy any condition of live statistics, pre-match and odds.
How can you follow a live match without being able to see it? ScoreTrend comes to everyone's aid with its bar charts that at any time allow you to see what is happening or what has happened previously with a simple click of the mouse or touch of your smartphone. It is possible to follow many games at the same time through several windows and apply the most appropriate strategy.
Once you have chosen your strategy, you can follow it live via the chart and decide when and if you want to exit your previous position. The charts of a match make sports trading increasingly similar to financial trading.
Bar charts
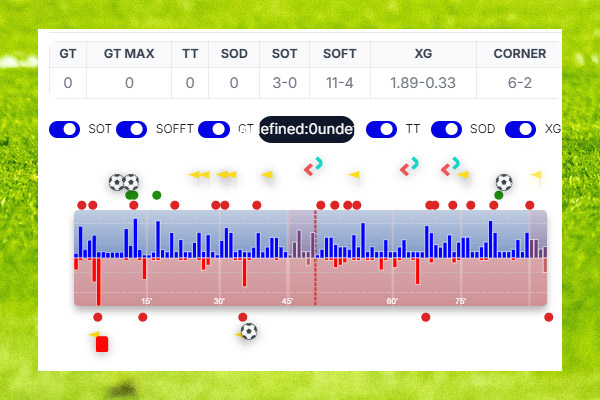
The characteristic element is the bar graphs that simplify the course of the match by histograms. The home team has blue bars, while the away team has red. Every 30 seconds the bar is formed and completed as the minute passes with the definition of the coloured rectangle.

The higher the height of the bar (close to the upper limit), the more intensively the team is playing attacking, shooting, corner kicks etc. The algorithm takes into account a whole range of parameters and summarises the game action by a number that gives the height of the rectangle. The higher the number of consecutive high bars, the higher the playing pressure of a team, as can be seen in the picture above: The home team, after conceding a goal, started to attack in a high manner and also collected a few corners. After several bars had reached the upper limit, the goal came.
If there are high bars on one side and then immediately on the opposite side, it means that the teams are playing wide, in counterattack and a goal for one of the two teams is in the air. Here it is suggested to enter on the lay the draw or do the over in successive steps.
You can find all the charts of all the matches that are being played live, including the lower leagues, Serie D, primavera etc. All matches have the same importance for us.
Goal Trend
Goal Trend is the proprietary indicator that anticipates the goal scored. The indicator is built with an algorithm that takes into account what is happening on the pitch through live statistics and in numerical form provides the intensity of play of both teams. Thechart is drawn with a red line with values ranging from 0 to around 160. The higher the value, the more likely a goal will be scored in the following minutes. Below the GT chart is a blue graph of the speed of change of the goal trend or slope of the curve. It is important to see the absolute value of the GT but also the speed at which it has increased. The higher the speed, the more in a limited time there were goal opportunities or dangerous attacks by one or/and both teams.
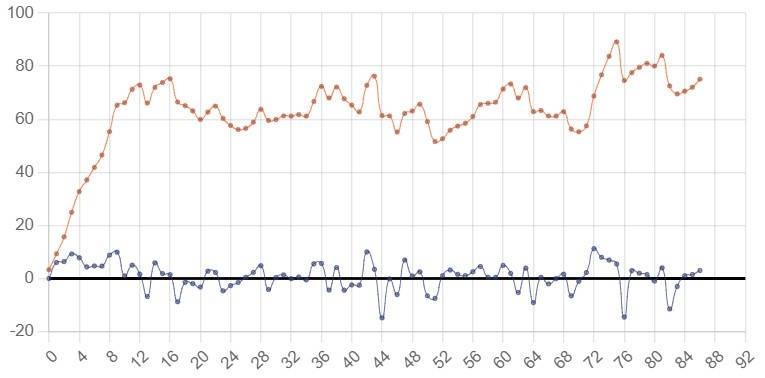
The goal trend values to be taken as reference are:
- 0-50 > few goal opportunities for both teams and limited intensity with occasional goal opportunities
- 50 - 80 > moderate intensity with chances for both teams. Shots on goal, shots on goal, attacks etc. The goal may come.
- 80 - 100 > high intensity game with several dangerous chances, corners, attacks and possible goals scored. Whoever is in the under market should exit and think about possibly entering the over market.
- from 100 - + > very high intensity of the game with lots of goal chances, counter-attacks by one or both teams, saves by the goalkeepers, shots and possible goals. Here we are in an extreme situation.
All the theories of technical analysis can be applied to the goal trend chart and the most appropriate entry points can be identified, such as breaking resistance, breaking double or triple tops, etc.
Team Trend
The team trend is the indicator with its chart that shows which of the two teams is playing more, making ball possession, etc. Positive values refer to the team that plays at home identifiable with the colour blue, while negative values for the team that plays away. With this indicator you can think about entering the tip on the team that is playing more if you study it beforehand.
Odds panel
The odds panel present in every football match is a very useful tool for immediate analysis and to understand if there has been a significant drop in odds which can have an important impact on the choice of strategy to be applied. Let us now describe the main items in the odds panel:
- start > is the starting price of the chosen bookmaker which in our case is bet365. This is the first price entered in the market and it has been built by the bookmaker's software taking into account the main parameters and then adjusted at your agio (profit of bookmaker).
- pre-match > the odds of the market at the time of consultation (before kick-off) and the last recorded odds before the match starts
- live > the live odds of the selected market
Next to the odds you will find green and red arrows according to their trend over time and you should pay attention to the odds or drop.
- The green arrow points downwards if there has been a drop in odds. The drop in odds could be a signal to enter a bet on that market as there has obviously been some information about the team, motivations etc that have led to the drop in odds. This is just one piece of information that needs to be confirmed with a qualitative analysis of the pre-match statistics of the match.
- the red arrow pointing upwards indicates that the odds have risen and there has been information, betting, etc. to the contrary.
The under/over market is important to enter the goal markets and understand which one is the reference market. The goal market around the parity is entered, i.e. the one with an odds of around 2.00 which becomes the predominant and reference market. It is advisable to watch during the course of the match when there are high bars on the bar chart or high value of the goal trend what is the value of the under/over to decide to enter.
Scoretrend information windows
Below the bar chart of each match there are windows with basic information to analyze and read in detail the selected match.
Live stats
The live stats are collected in a panel with the relevant icon and updated every 30 seconds. 4 different categories are available:
- All: live stats of the whole match
- 1st half: first half statistics
- 2nd half: second half statistics
- Minute bands (time bands of 15 minutes each)
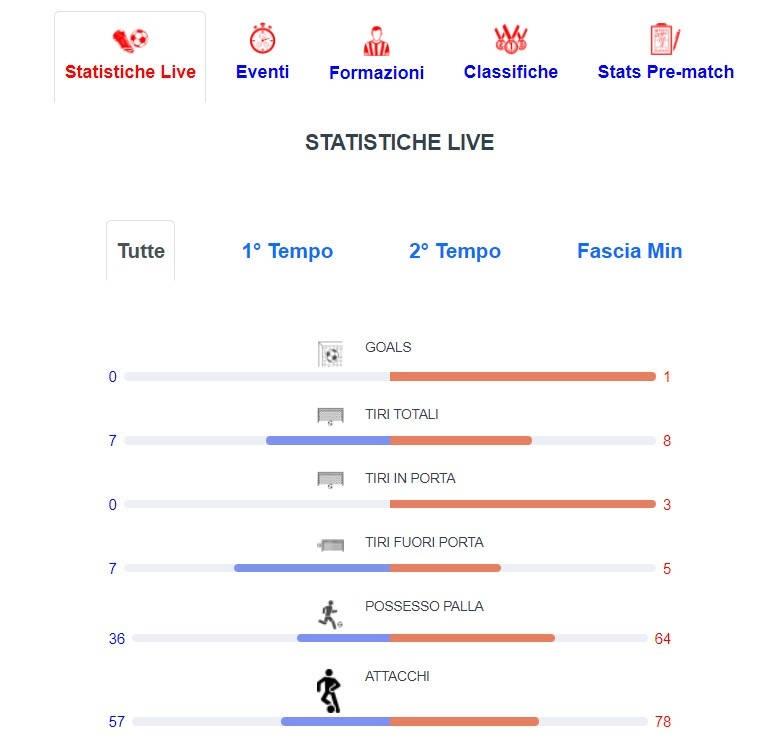
The live stats depend on the importance of the selected league and consequently on those provided by the provider: these stats depend on the provider who sends them, as the latter has a proprietary and non-homogeneous method of calculation and therefore one must be careful.
The live stats are: shots on goal, shots off goal, attacks, dangerous attacks, yellow cards, red cards, offside, penalties, substitutions, fouls, balls recovered, goalkeeper saves, goal attemps.
Events
In the events section of the match, all the highlights of the match are displayed in real time in a tree structure, indicating the minute they occurred. The events included are: corners (indication of number), shots on goal (name of shooter), shots off goal, substitutions, goals, etc.
Lineups
Below each match there is a lineups window where about 15-20 minutes before the start of the match, the formation of the two teams and their playing form is entered. Obviously they are available for matches in the world's major leagues (Serie A, Serie B, Premier League, La Liga, Ligue 1, etc.) and for top matches. For lower leagues they are not available and therefore will not be shown.
Standings
The league or international competition rankings available are
- total (all matches played) with an indication of the goal achieved
- home (standings with matches played in your own stadium)
- away (standings for games played away from home).
The ranking to be taken as reference is the total ranking with graphic indication of the goal reached by the team such as relegation zone, playoffs, champions zone, europa league zone, etc. This indication is very useful in the last matches of the championship where the motivation regarding a goal to be reached can be an important indication on the course of the match in question.

Gianluca Landi
Professional Sports Trader | Founder of ScoreTrend
Sports trader since 2007 and online with the first sports trading site and courses since 2011. Engineer specialized in data analysis and betting exchange strategies. Amazon bestselling author and founder of ScoreTrend, the leading platform for match trading and betting with proprietary indicators such as xTrend, Goal Trend, SOD, and Draw Balance.
 ES
ES  IT
IT 